Music Dashboard
up to ResumeWhat would you report on?
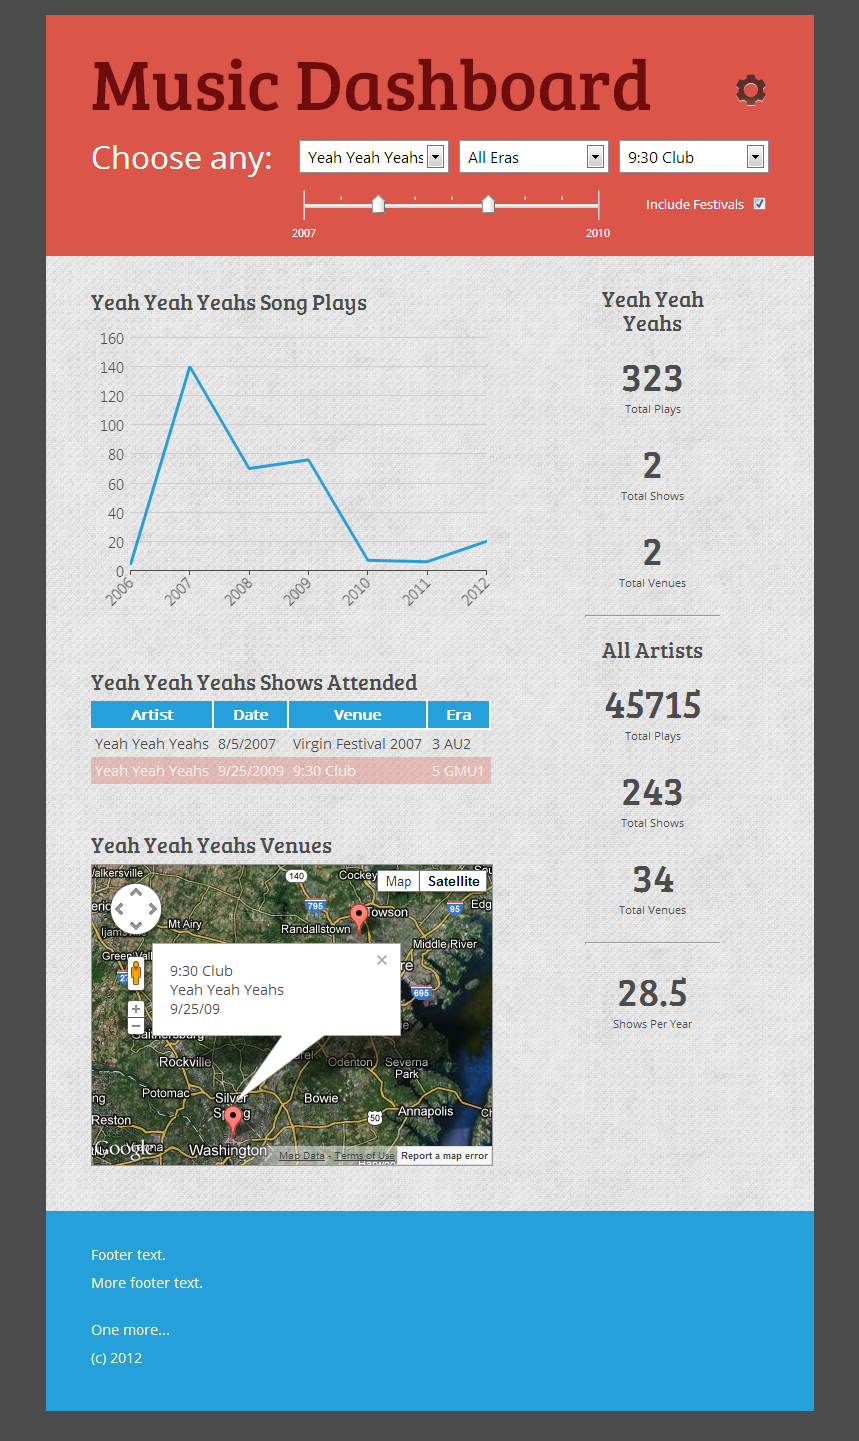
I was asked to create a sample application as an “audition” for the Web App Developer position at Logi Analytics. I knew my ridiculous data collection of personal music habits had finally proven its worth.
Armed with a database dump of my Last.FM song play data since 2006 and a spreadsheet of every concert I’ve attended, I decided to correlate the two based on common artists.
Conceptualize the Analysis
I began, as usual, by whiteboarding ideas and quickly creating a series of Balsamiq wireframes to sketch out the concepts I had in mind. The goal was to combine these data sources and use a single control area to analyze the results.
Learning Logi’s Business Intelligence tool
Logi Info is a BI platform providing a desktop interface to create web applications. Bring your data, all kinds accepted. Connect it to charts, tables, and basic web paradigms and start analyzing.
I created a Logi Info application with custom CSS, web fonts, and as much polish as I could muster (for 2012, okay) in my “20-40 hour” project.
Lessons
I learned some BI basics and how to implement data visualizations on the web.
I learned that I needed a little bit more database training, and subsequently took the Stanford Online Intro to Databases course.
But most importantly, I learned how to sell a B2B2C platform as a product deployment.